WEM, LLC provided support scheduling support to Staff Electric and its joint venture partner on both the electrical and low voltage / technology scope of work, totaling approximately 173 thousand labor hours.
(See Figures C1 & C2 for renderings of the project completion)
LOCATION: Milwaukee, WI
SIZE: Electrical (Divisions 26A and 27A) Scope ~ $50 million
DURATION: 2 years
Wisconsin Center: Figure C1
Wisconsin Center: Figure C2
1. Creating the APS™
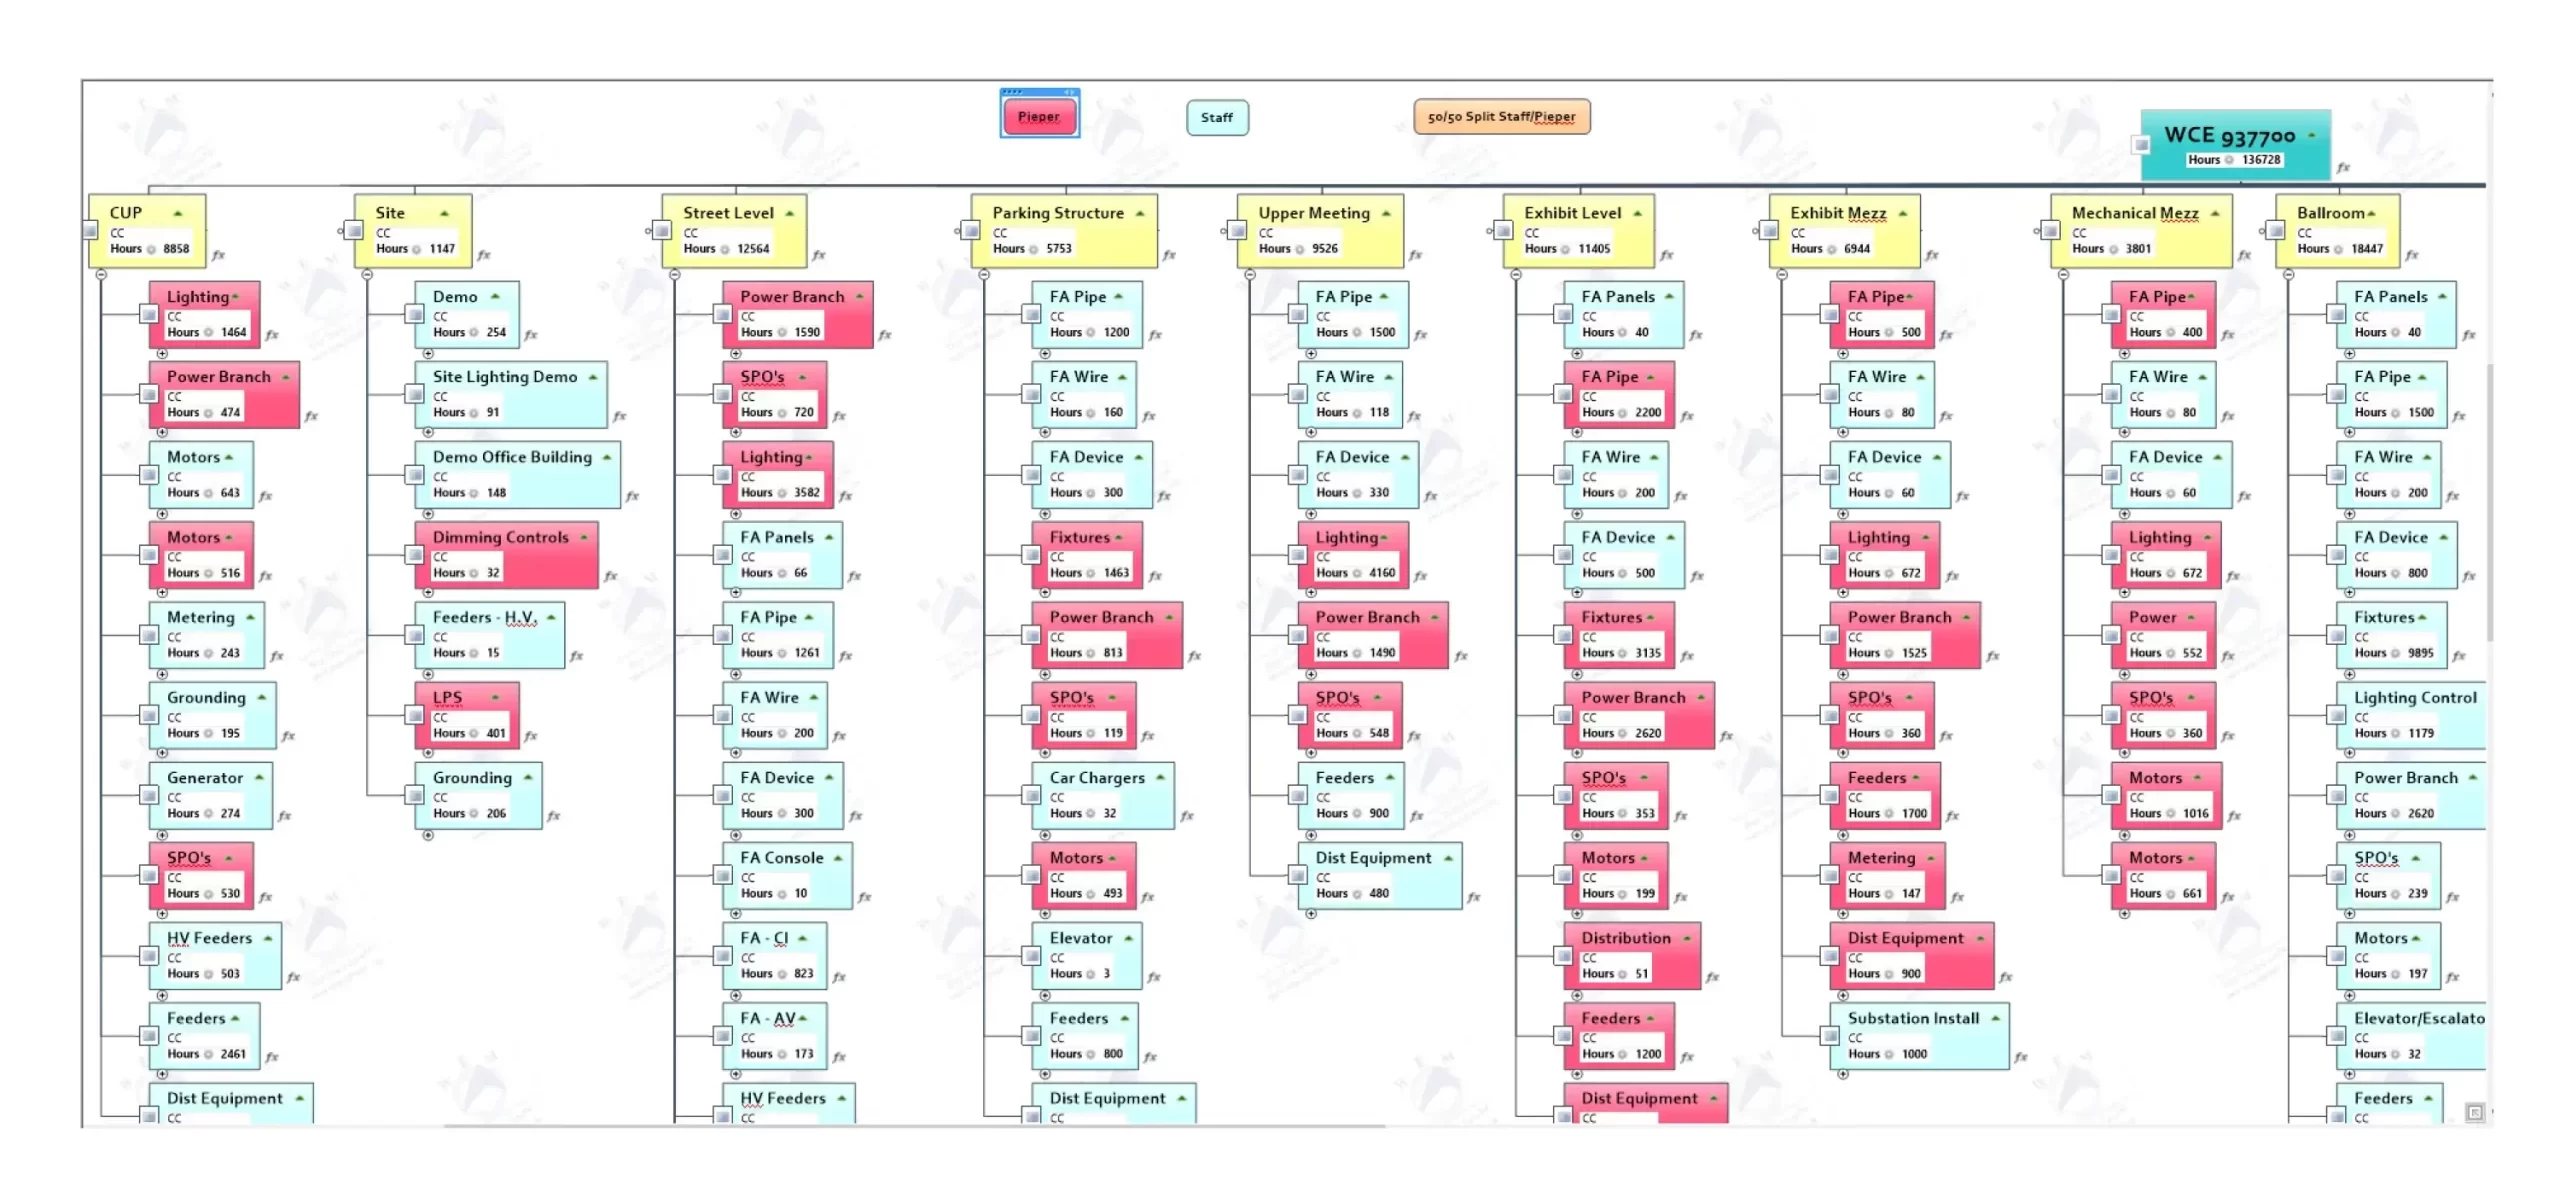
Creating the trade WBS: Figure C3 shows one section of the electrical work breakdown structure, color coded to represent the two different EC’s scopes of work. The top level of the structure were areas that connected directly to the structure of the GC’s schedule, allowing the detailed work breakdown to be planned within (sequence of work) and planned for connections to the overall project sequence of time
Figure C3: WCE Project WBS
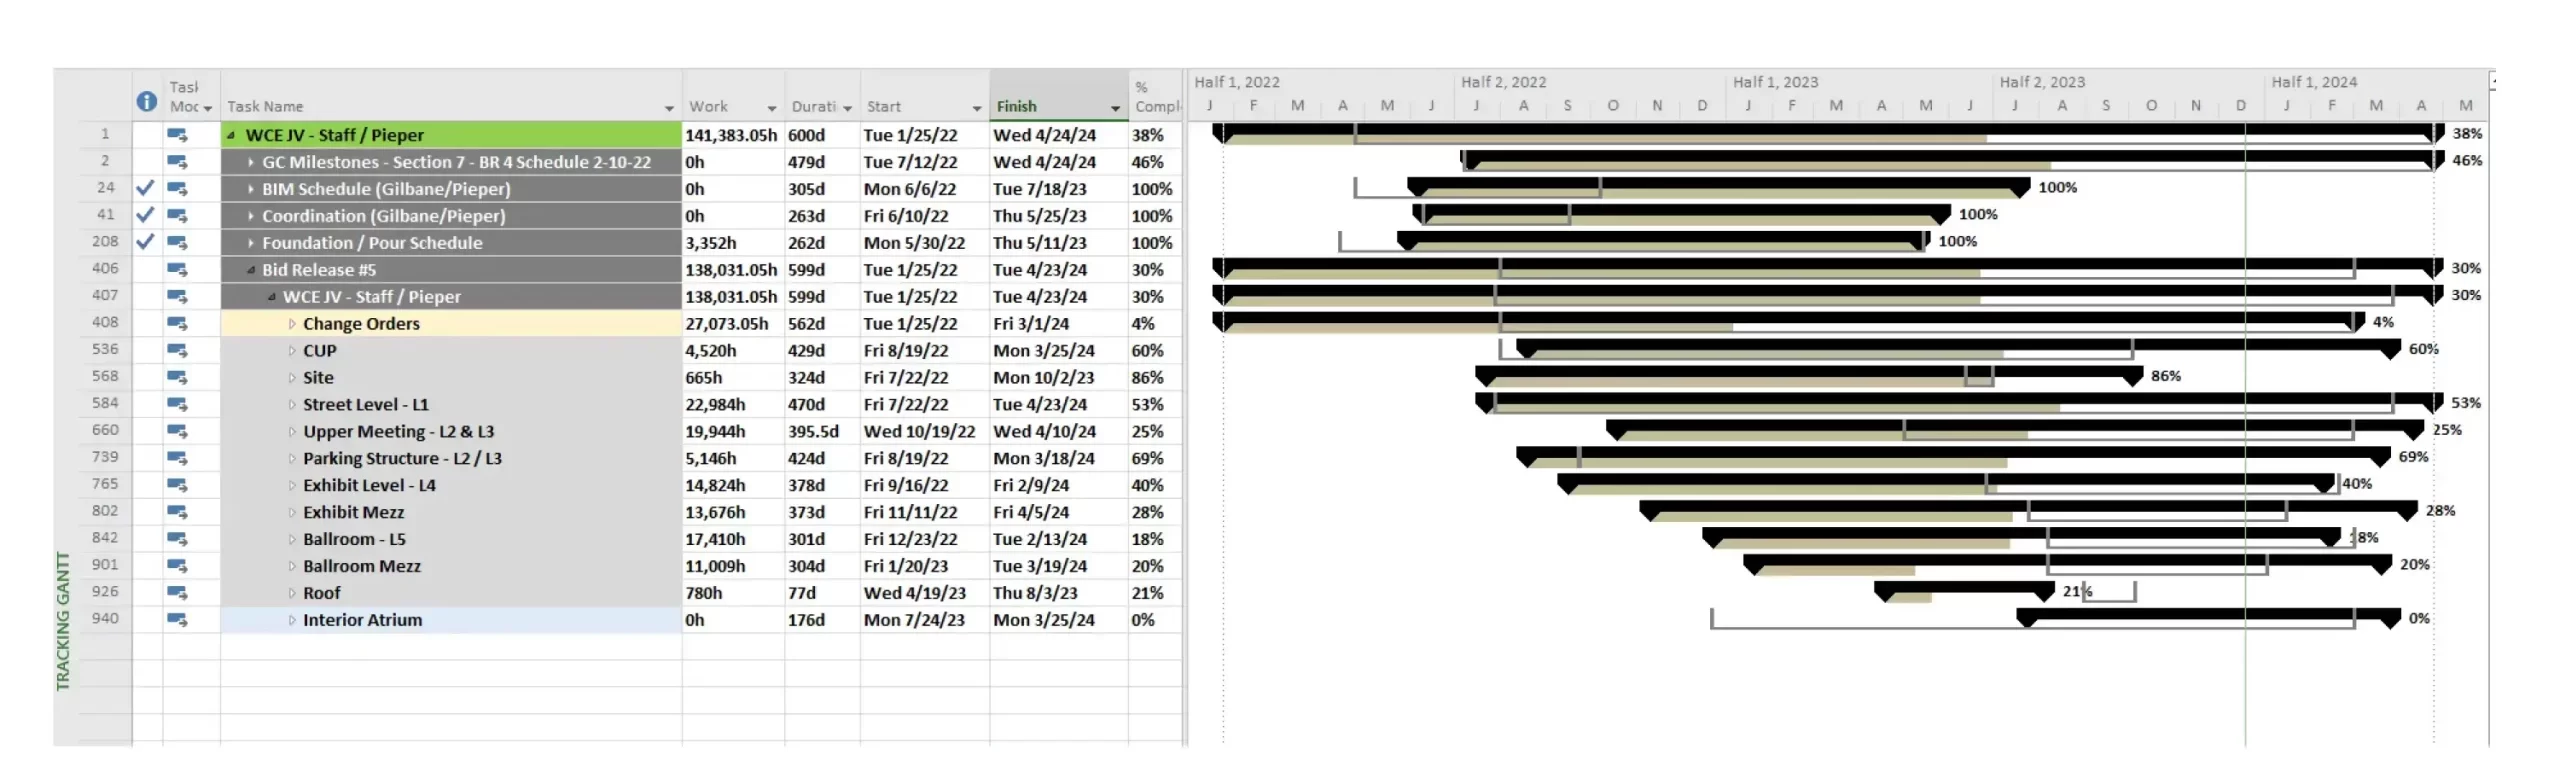
Figure C4: WCE Project Schedule
Figure C5: WCE Project Model
Connecting work, effort, time: Figure C4 shows a summary of the project schedule, reflecting the GC’s overall project plan, with the embedded work and predecessors of the EC’s. Figure C5 shows one section of the schedule where the EC tasks are broken down to match their WBS yet are interconnected to the overall flow. This is what builds the Project Model, interconnect Work, Effort, and Time. If a task slips, starts late, or finishes early, the interconnection of related work allowed the impacts to be visible immediately.
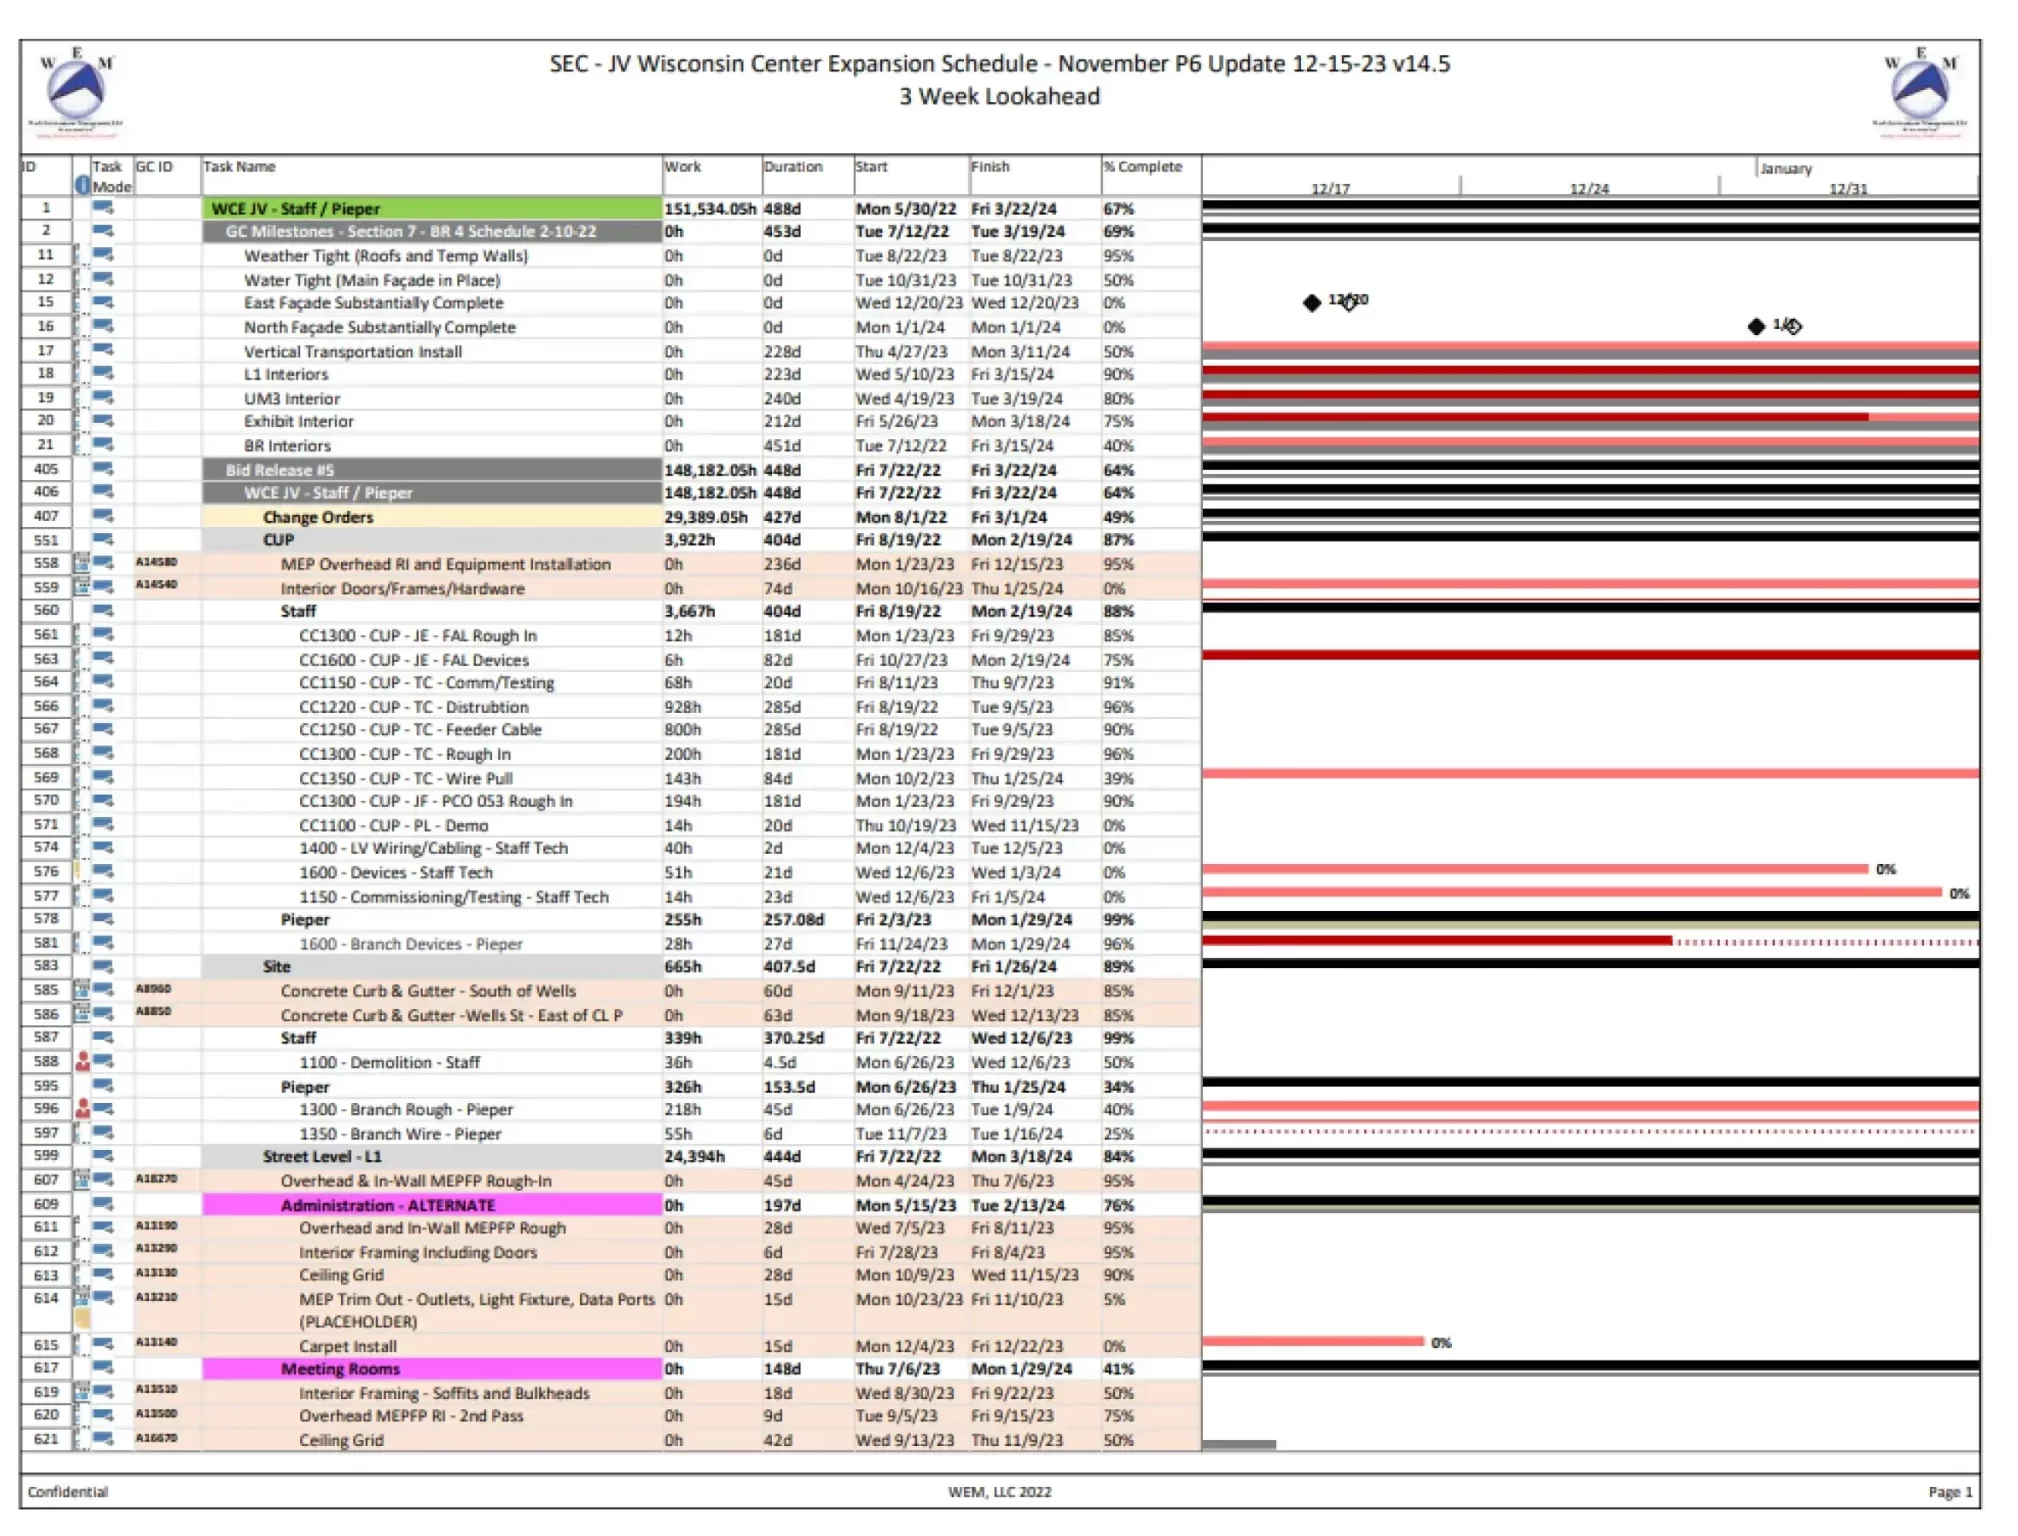
Using 3 week look ahead for planning work and effort: Figure C6 shows how the schedule was used for the EC’s to plan their work in individual areas on a weekly basis. This is a 3 week look ahead of planned work; sometimes this planned work could be scheduled and other times not. For example, if an area showed branch rough in planned to complete in week 2 but the EC’s knew that wasn’t feasible due to waiting on some wall framing to be complete, such reasons were captured in a Schedule Impacts capture within SIS®.
Figure C6: 3 Week Lookahead
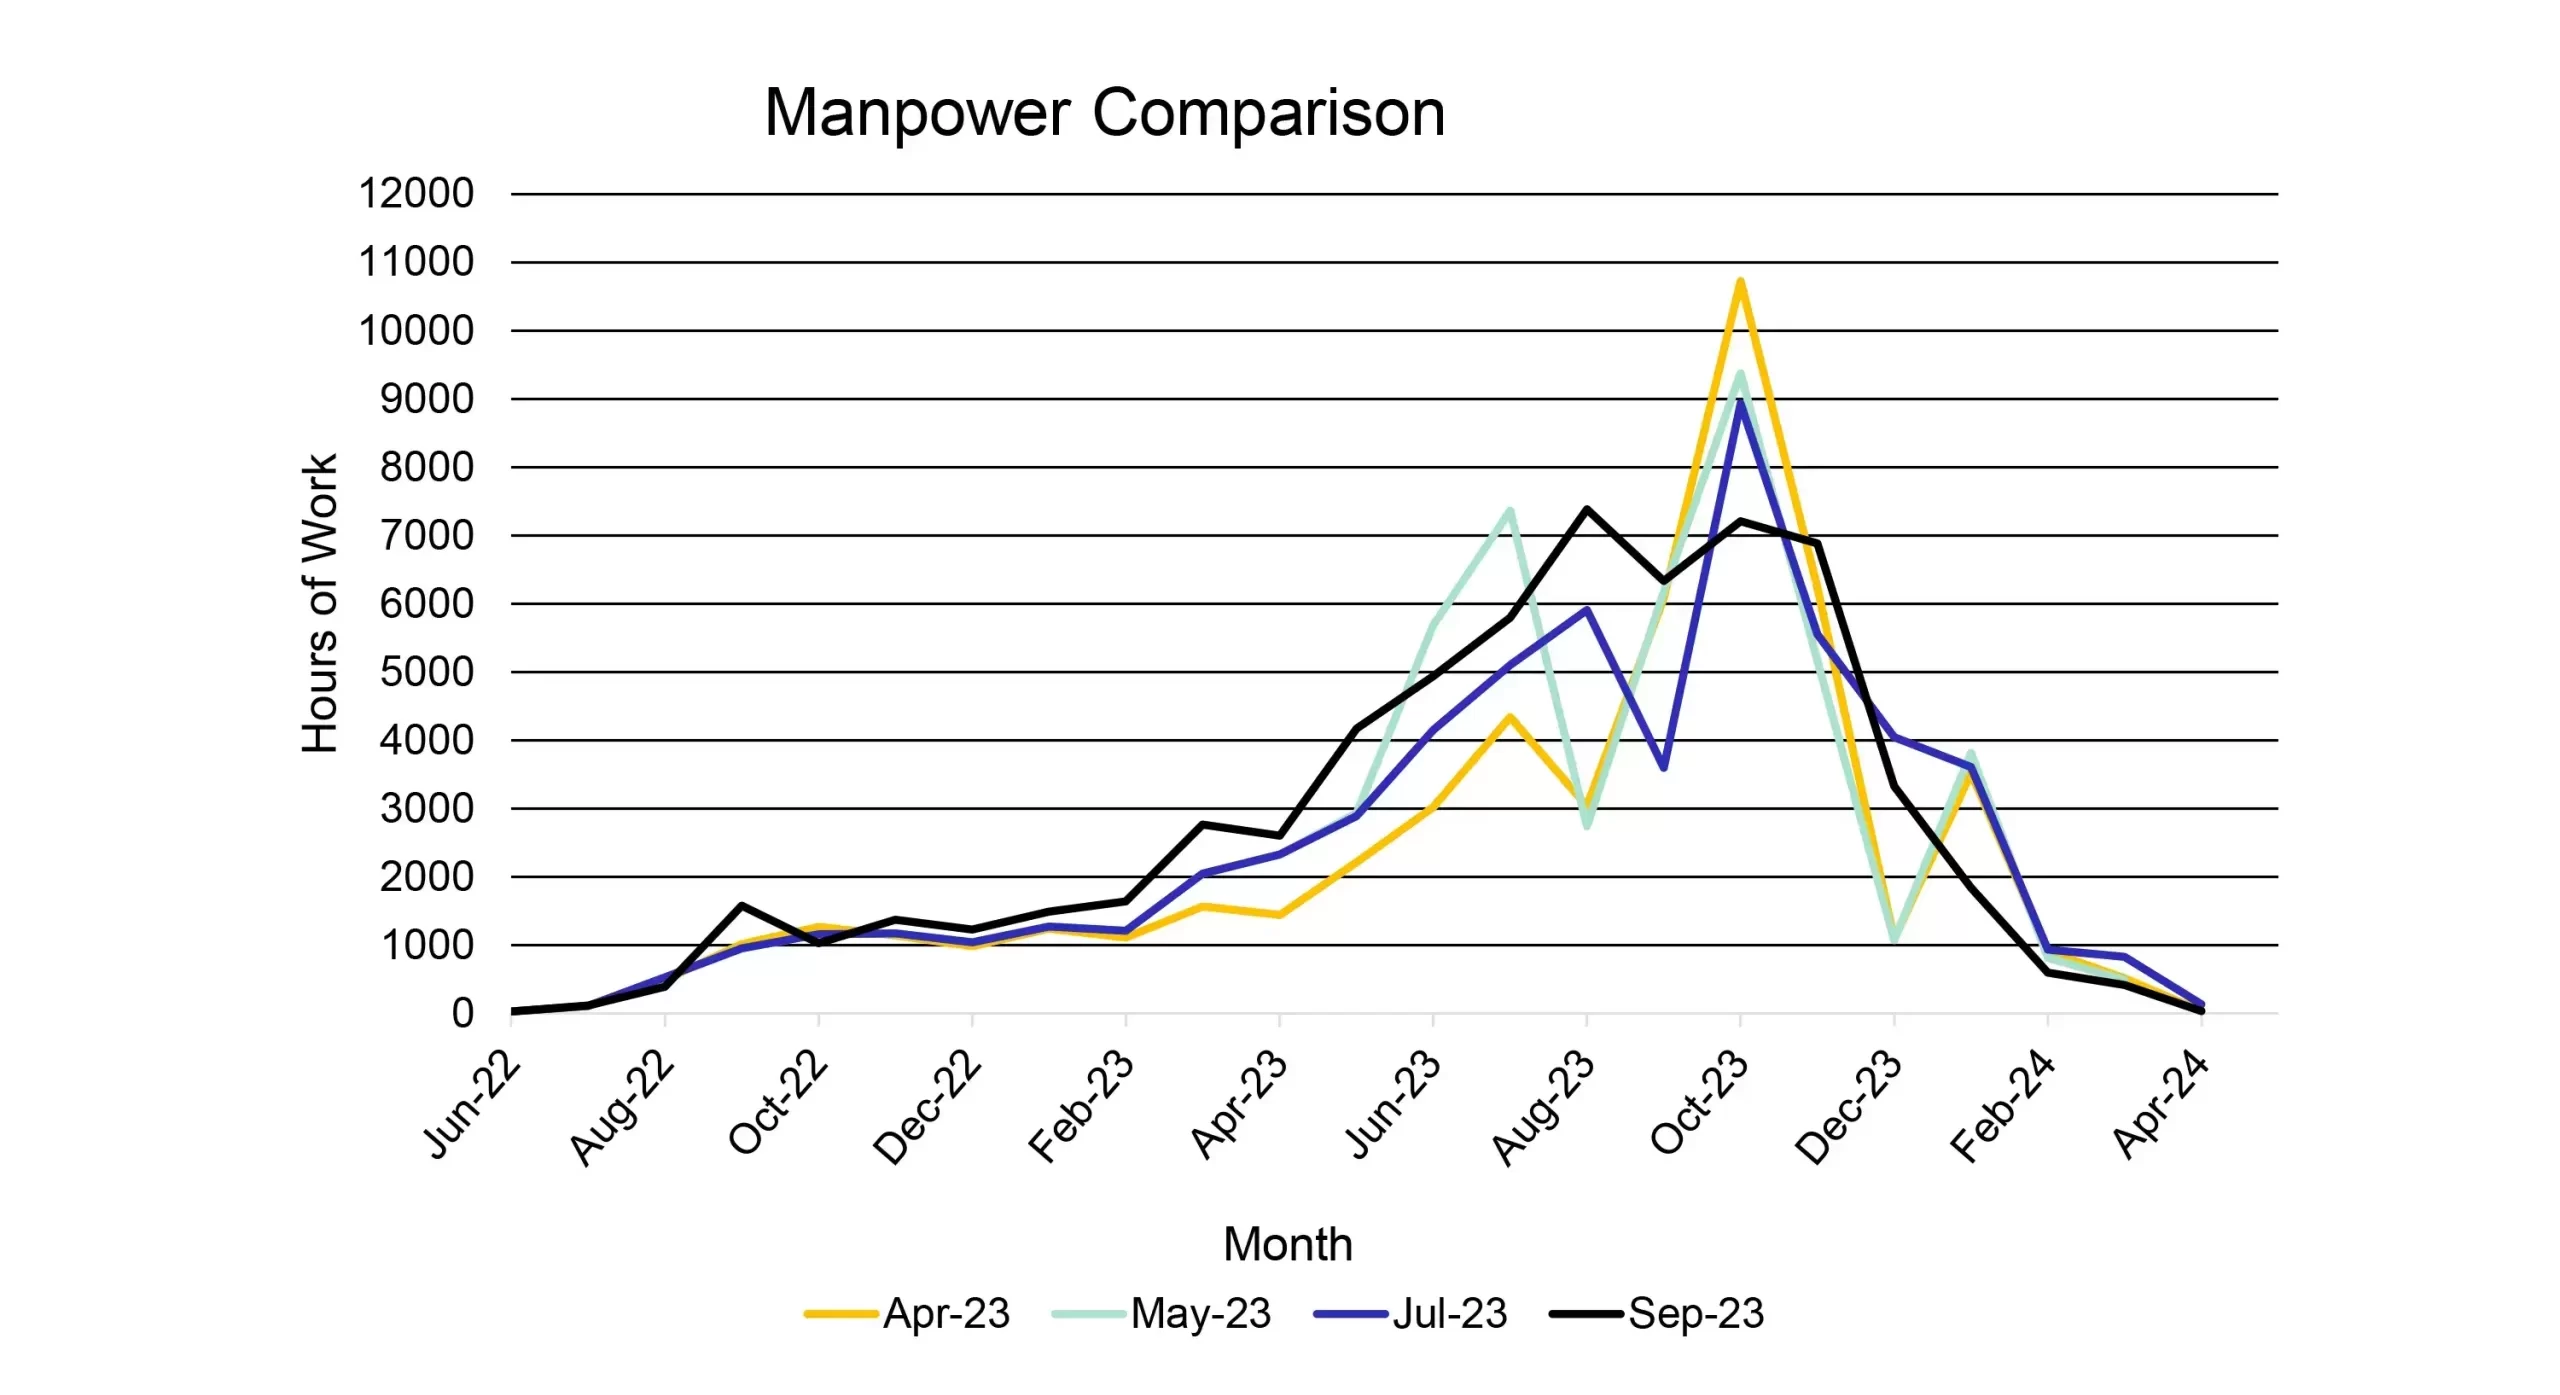
Figure C7: Manpower Loading Flattening the Curve Through Collaboration
2. Proactive “modeling” of Work, Effort, Time
Flattening the manpower curve: having more manpower onsite than available or needed can be a productivity drain for the trade contractors due to trade stacking, compression, overtime, and can lead to risks such as exposure to safety hazards. By modeling the manpower loading based on the Work, Effort, and Time interconnections, the EC’s were able to evaluate their required manpower and identify that a peak of 8-11 thousand hours in the month of October would not be ideal or potentially infeasible. In a review between EC and GC, “gaps” of opportunity were identified by WEM, LLC reflected as areas where EC resources could be available early (either onsite or through prefab) to pull ahead a sequence of work decoupled from the sequence of time. Figure C7 shows the results in the project model, flattening peak manpower to 7,000 hours. Reduce risk in the home stretch: by managing the work, effort, and time proactively, the contractors could model what needed to be done by when to open a very large and high-profile convention center “on time”, not to mention protect precious building finishes and assure all systems could be commissioned completely and timely.
3. Data-based feedback from subs:
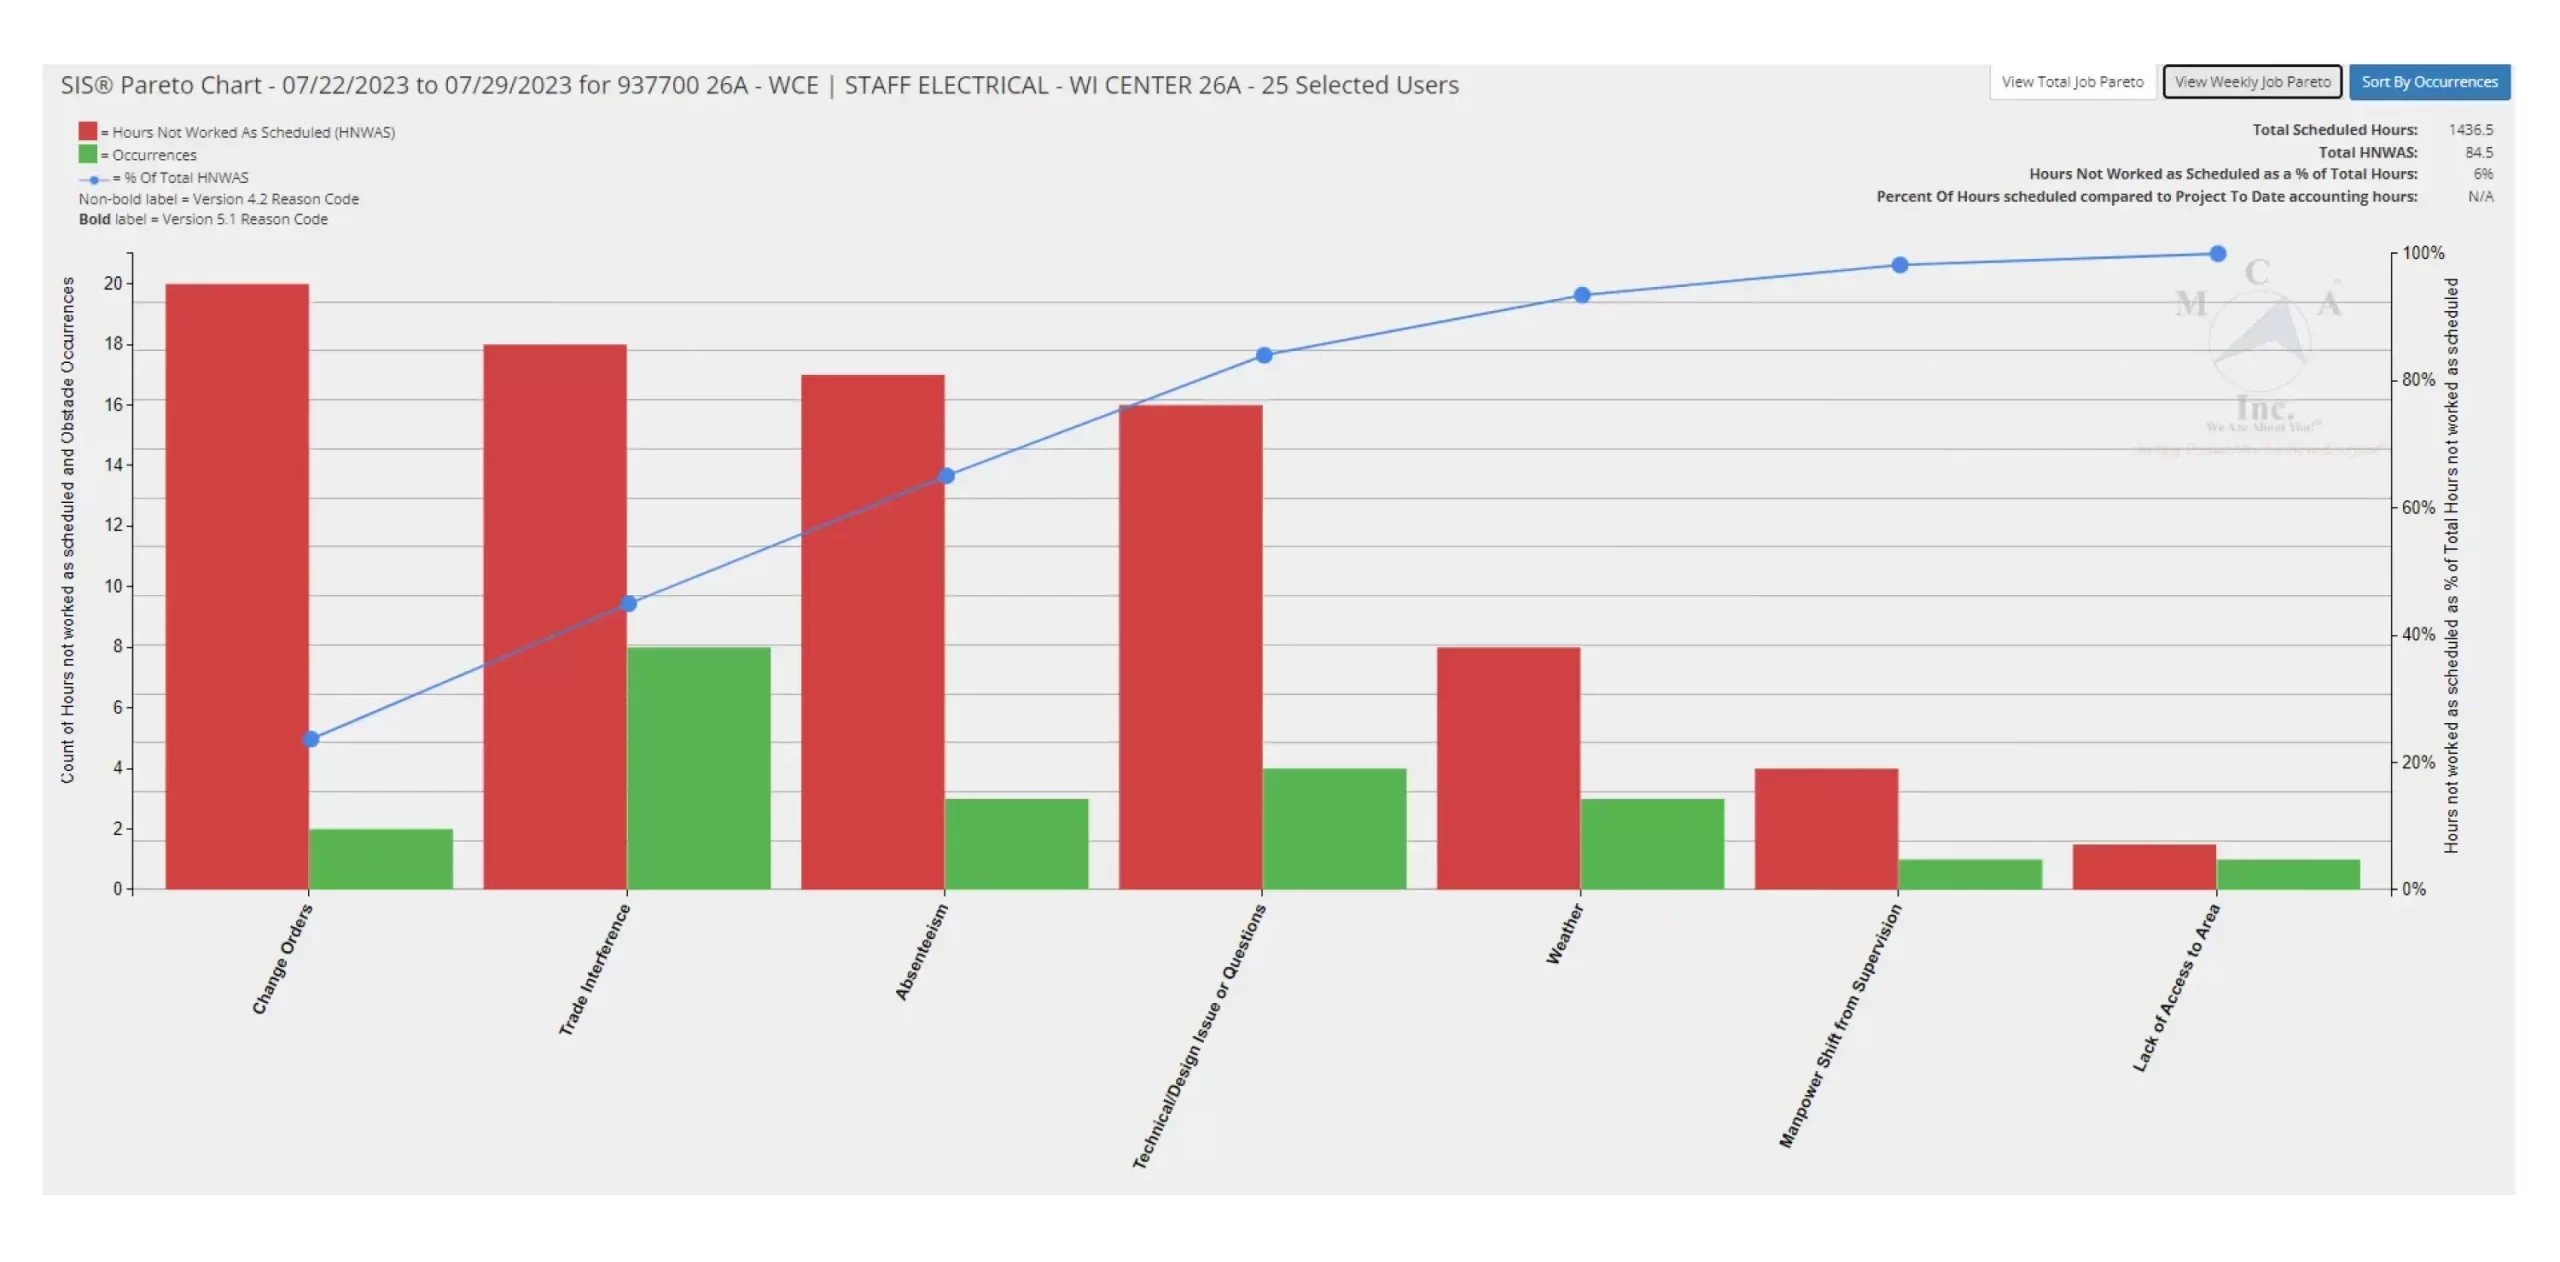
Tracking schedule impacts: the EC collected data on obstacles to daily scheduled work using SIS®, monitoring obstacles to “work” due to schedule-related “time” impacts. Figure C8 shows a Pareto chart of obstacles in July timeframe, when manpower was starting to ramp up onsite and meanwhile other trades were using traditional approaches to “just get the work done” without adhering to the sequence of time and work being coordinated between the EC and GC.
Figure C8: SIS® Summary 07/22/23 to 07/29/23
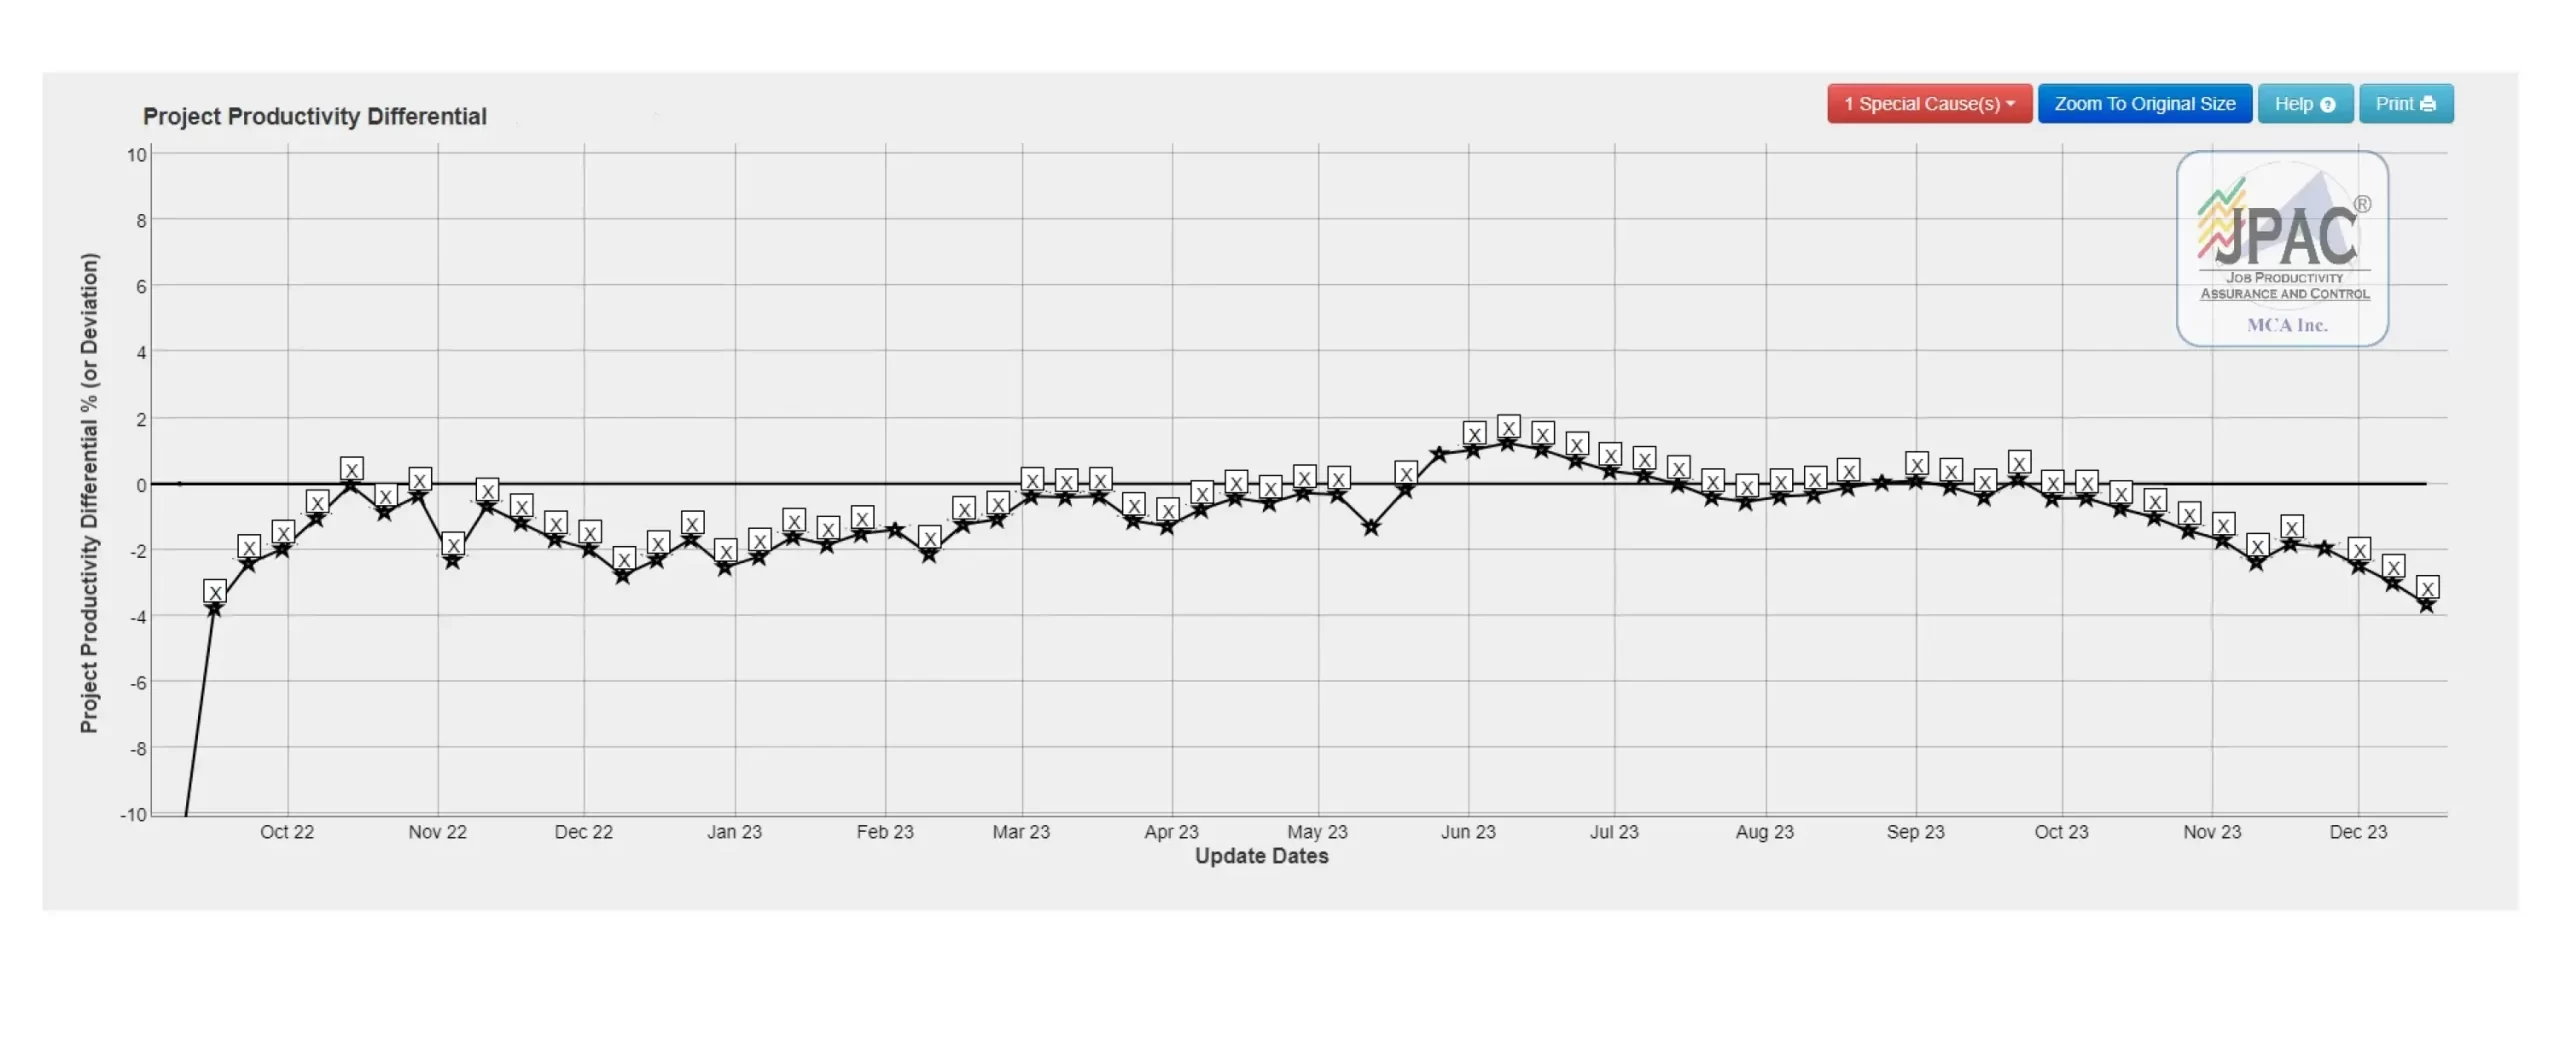
Figure C9: WCE Project Productivity
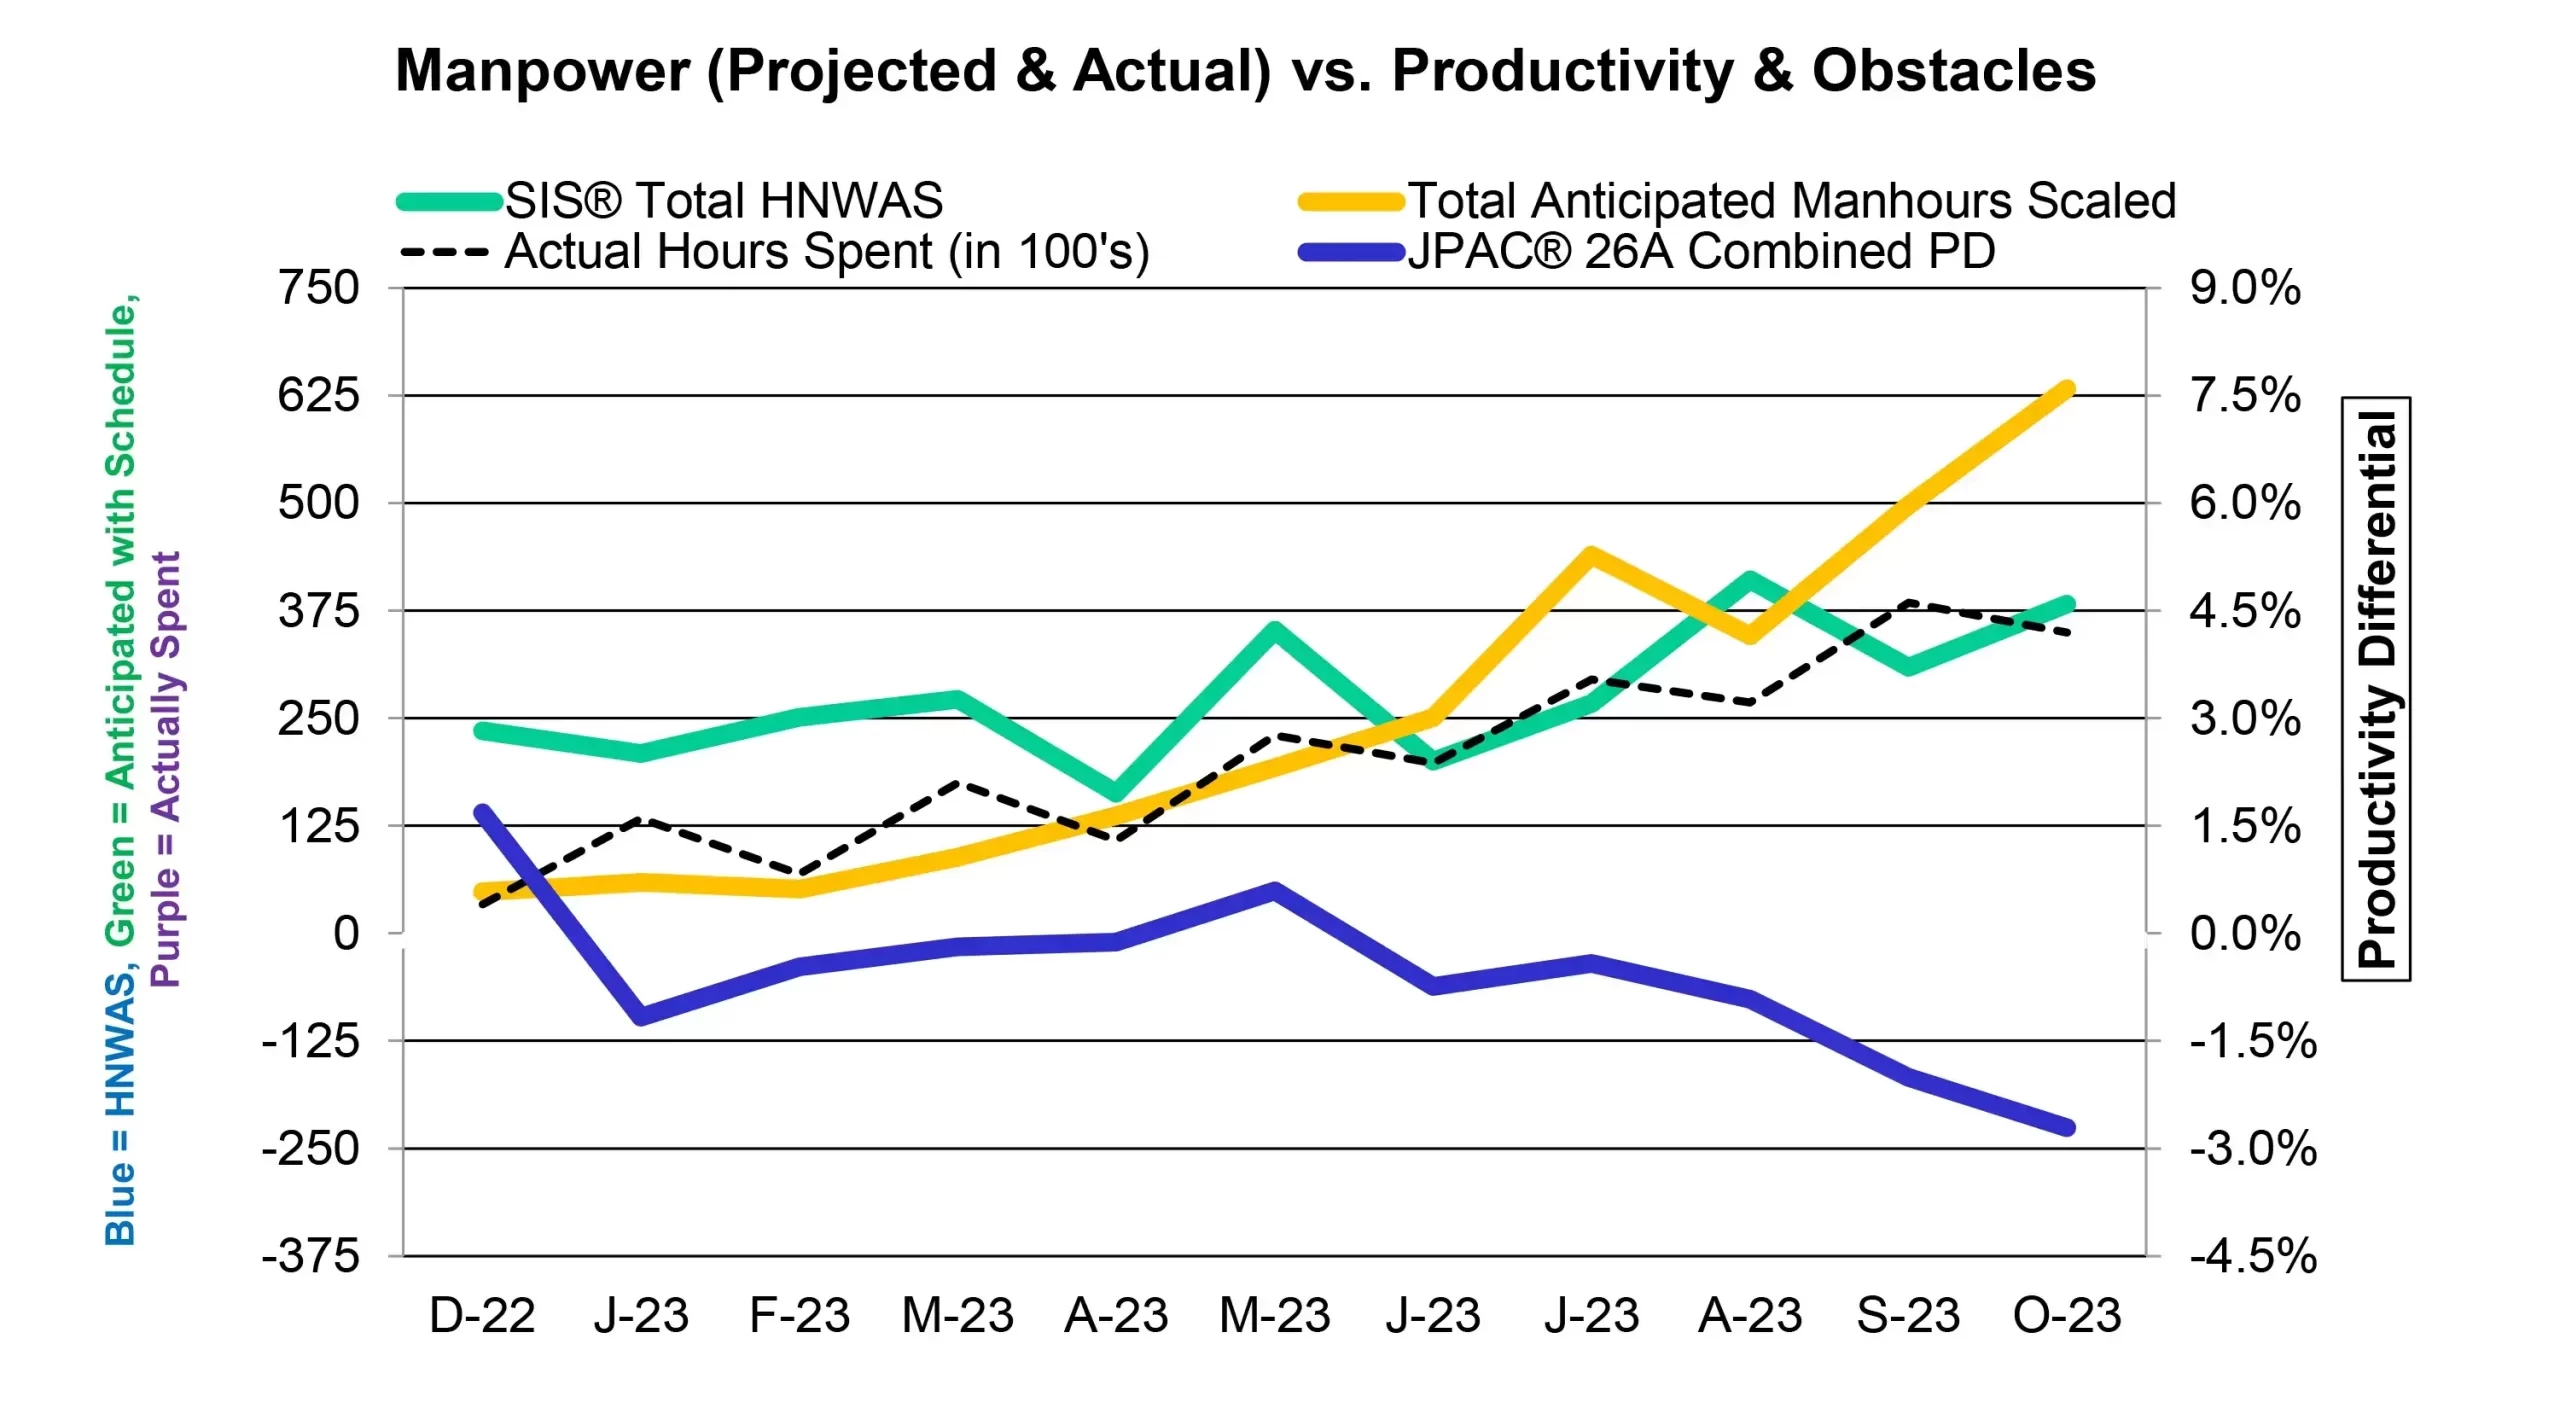
Figure C10: Productivity Impacts Manpower Increases and Schedule Obstacles
Measuring productivity: to monitor and confirm that the schedule model was resulting in and maintaining stable productivity, the EC used JPAC® (application of ASTM E2691) for measuring productivity differential. Despite some “ups and downs”, the EC project team maintained productivity within +/- 5% of their expectation which is unheard of on a job this size. See Figure C9 for the job to-date productivity trend.
The overlay of manpower loading, productivity, and schedule impacts (see Figure C10) clearly shows that manpower increases lead to more obstacles and reductions in productivity. This data-driven project management using APS™ proves that the harmony of work, effort, and time needs to be managed and monitored.